
In the example it was shown that after one complete cycle, when all three spheres had the same constellation as before, they had moved for the same distance. So the whole system had moved this distance. Generally the distance the system has moved can be described as the movement of its barycenter.
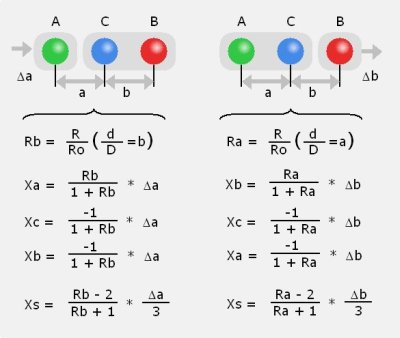
For three spheres A, B and C the distance the system has moved is Xs = (Xa + Xb + Xc) / 3.
When it is correct to divide the movement of one sphere which is Δa for sphere A or Δb for sphere B into the movements Xa, Xb, Xc of the subsystems according to their flow resistance then it can be described as in figure 14:
 |
This means that Xs as a function of a and Xs as a function of b can be added to describe a sinusoidal movement of both spheres at the same time as it was carried out in the experiment.
In figure 15 the supersposition of the two movements is depicted in an extended state diagram.
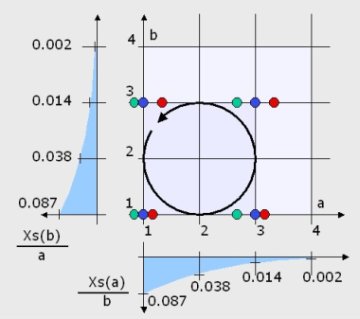 |
With the general description of figure 14 a movement between any two points of the plane for a and b can be described. So the sinusoidal movements of the experiment with a phase shift of 90° can be described as the the circle in the plane a,b.
For the calculation the circular movement is split into small fractions and the the functions for the movement of Xs are applied.
The blue curve on the left shows Xs(b)/a. Its value states which fraction of the movement of sphere A gives the movement of the barycernter Xs. The value of this function Xs(b) depends on the value of b, which means how far sphere B is stretched out from sphere C.
For confirmation: If b is large, the value of Xs(b) is very small. This means the spheres B and C are separate and have twice the flow rsistance of A. If A moves, it moves twice as fast in the opposite direction of B and C. The result is no movement of the barycenter. On the other hand if b is small, the flow rsistance of B and C is smaller than two times the flow resisitance of A and with any movement of A the barycenter moves (pushing away B and C almost as far as A moves to the opposite side).
The blue curve at the bottom is just complementary, showng Xs(a)/b the movement of the barycenter for the movement of B.
The simulation shows a movement of the system which is per cycle 11% of the elementary distance of 60mm.
This is 6.6mm compared to 4,8mm of the measurement.
This means the real system in the experiment moved 73% of the calculated value.
Figure 16 is one output of the simulation in which the circle is divided into 40 segments. The progress of the barycenter is included in the diagram, drawn over the same horizontal axis of a with the same scale. After about 9 cycles it reaches the elementary distance of 2.
|