
The test set up is according to the data on the first page. The two outer spheres are driven the elementary distance out from the contact to the inner sphere and back. The phase between the two movements is pi/2.
The data are:
|
|
||
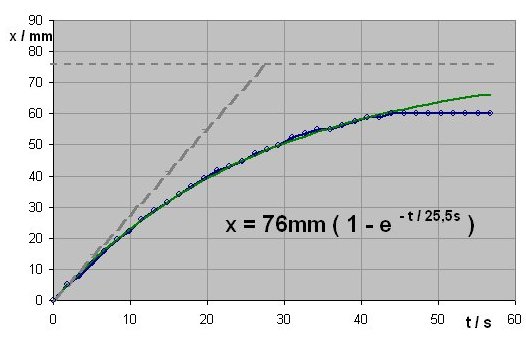 |
Figure 5 shows the curve of the movement for the first minute after the start. The blue line represents the values of the progress once per period so that the oscillation of the system is not visible. The movement was taken by a DV camera and the measurement was made by analysing the pictures on the computer screen.
When the system is fixed to the pendulum and driven by constant force, it moves freely at the lowest point and is drawn back by a force proportional to the distance to the lowest point. This results in a curve of the type x = xm ( 1 - e ^-(t/tau) ). As the curve has some distortions a curve fitting was made to achieve best results for its parameters.
The results are tau = 25.5 sec and xm = 76mm.
The result means that a maximum deflection of 76mm can be reached. (In the experiment the system reaches the surcface of the liquid at 60mm.) The deflection of 76mm equals a propulsion of 0.05N, (which is 0,1 of the effective weight).
The time constant of 25,5 s means that the starting speed is 76mm / 25.5s or 3mm/s.
These values result from a periodical movement of 1.6s. For a movement of 1s the values will be:
| T = 1 s | F = 0.08N | v = 4.8mm/s |
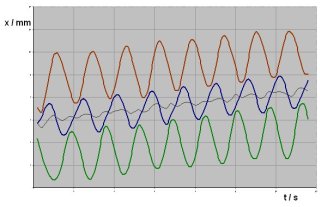
Figure 6 shows the movement of the spheres in more detail. Eight points per cycle are drawn over eight cycles but it still gives just a rough idea of the operation. The red, the green and the blue line represent the locations of the spheres over time.
The outer lines are shifted towards the blue line so that the distance between the lines represent the distance of the spheres insted of the distance of their center points. So it becomes more obvous how the objects come close to each other during the operation.
The red line and the green line show the sinusoidal distance that the outer spheres have from the sphere in the middle. The red and the green line have a phase shift of 90° towards each other.
The black line in the middle shows the position of the barycenter. It should move with the same frequency and small amplitude along with the shperes. A distortion of the cuve-form might come from an uneven rotation of the motor under load.
 |
 |
If two spheres are close to each other, they together form a subsystem with a small flow restistance and they are pushed by the remaining system more than when their distance is larger. (The role of being part of the subsystem or outer sphere changes during the operation.)
Outlook:
For a better understandig of the behaviour of the system the subsystem of two spheres will be analyzed. For two spheres, one following the other with constant distance, the flow resistance shall be determined as a function of the distance.